When coding in any language, it’s a great help having a way to step through the code, line-by-line, to see what the variables contain, and watch how the program handles logic. To demonstrate, let’s insert an extra line that’ll set the full datetime to a variable, then create the dayOfWeek from that interim variable:
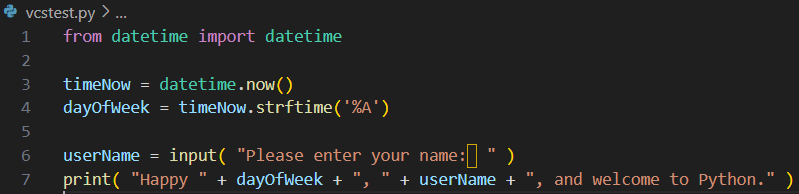
Here we have timeNow being set to the value generated by datetime.now(). Then, dayOfWeek is set to the string-formatted value from this internal timeNow. Running the script should produce the same output as before; it’s what’s happening inside that we’ll be looking at next.
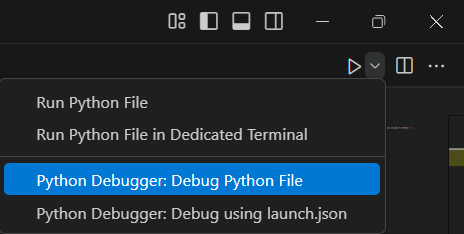
To start the debugger in VSC, click the pull-down next to the run icon, and choose Python Debugger: Debug Python File:
A similar Terminal window should open, and show the program running just as before. To see the real benefit of the debugger, click once in the space to the left of the line number so a red dot appears, as shown here:
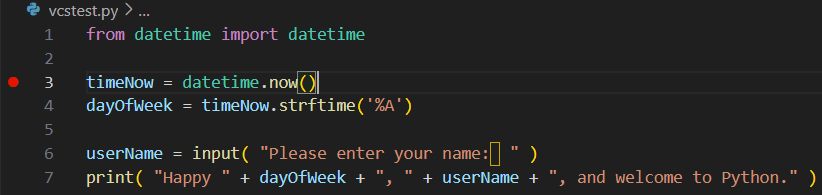
That red dot is representing a “breakpoint” setting. When the program is run in a debugger, the breakpoint will cause it to stop just before executing that line. In this case, we chose the first executing line of the code, so that we can step through the rest of the program.
Use the Python Debugger: Debug Python File option to run it again, and the process should stop at this timeNow line:
![]()
Along the top edge of the edit pane there should be a new set of controls:
![]()
These control the debugging process. The first is Continue, which’ll run the rest of the code (until another breakpoint). The next, the dot with the over-arching arrow is for “Step over.” There are also step into, step out of, start over, and stop controls available. The one we’re most interested in presently is Step Over. If one hovers the mouse cursor over these, their functions will appear, but also things like “F10” — these are single-key actions. So, pressing F10 will Step Over (and execute) the present line.
Use F10 to step over each of the lines within the program. After each step-over, notice the Variables area gets updated. Expand the separator between the left and right panes to allow viewing the entire value. It should show something like the following:
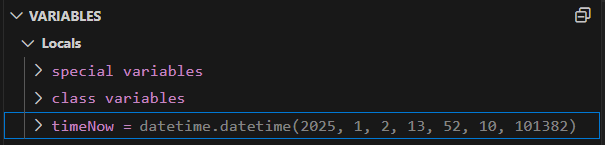
At this point, I must apologize and correct my previous statements about epoch-time. Although Python stores time as an epoch reference, the datetime data is actually broken up into the structure that shows here:
- year = 2025
- month = 1
- day =2
- hour = 13 (1pm)
- minutes = 52
- seconds = 10
- microseconds = 101382
Without the debugger, we’d have been assuming datetime is just epoch, which could have impacted how we wrote our code to access the datetime data. Stepping through the code allows us to avoid assumptions, which is a critical habit to have regardless of which language being used (including English).
Pressing F10 (Step Over) again will execute the dayOfWeek line. The Variables area should update, showing dayOfWeek, and its value.
When stepping over the next line, which is getting input, the Terminal window should show the prompt for the name. Click on the Terminal window, and then enter something, at which point the debugger step should get to the print line.
One more step-over, and the program’s done.
In normal operation, especially with large programs, the first step is to set a breakpoint at the start of a code “block” that needs to be checked. Run with the debugger, and it should stop at that breakpoint. Step-over each line, observing the variables and logic. When through our section of code, just click Continue (F5) to run the rest of the program (or until the next breakpoint).